
Examples that show the difference.
A structured portfolio of seismic examples, with dedicated pages for each case study.
Portfolio-style case studies.
Two-month target-oriented reprocessing
A modern public dataset was reprocessed with the Jurassic interval as the primary target. The objective was to deliver a better screening dataset without the turnaround of a full conventional reprocessing project.
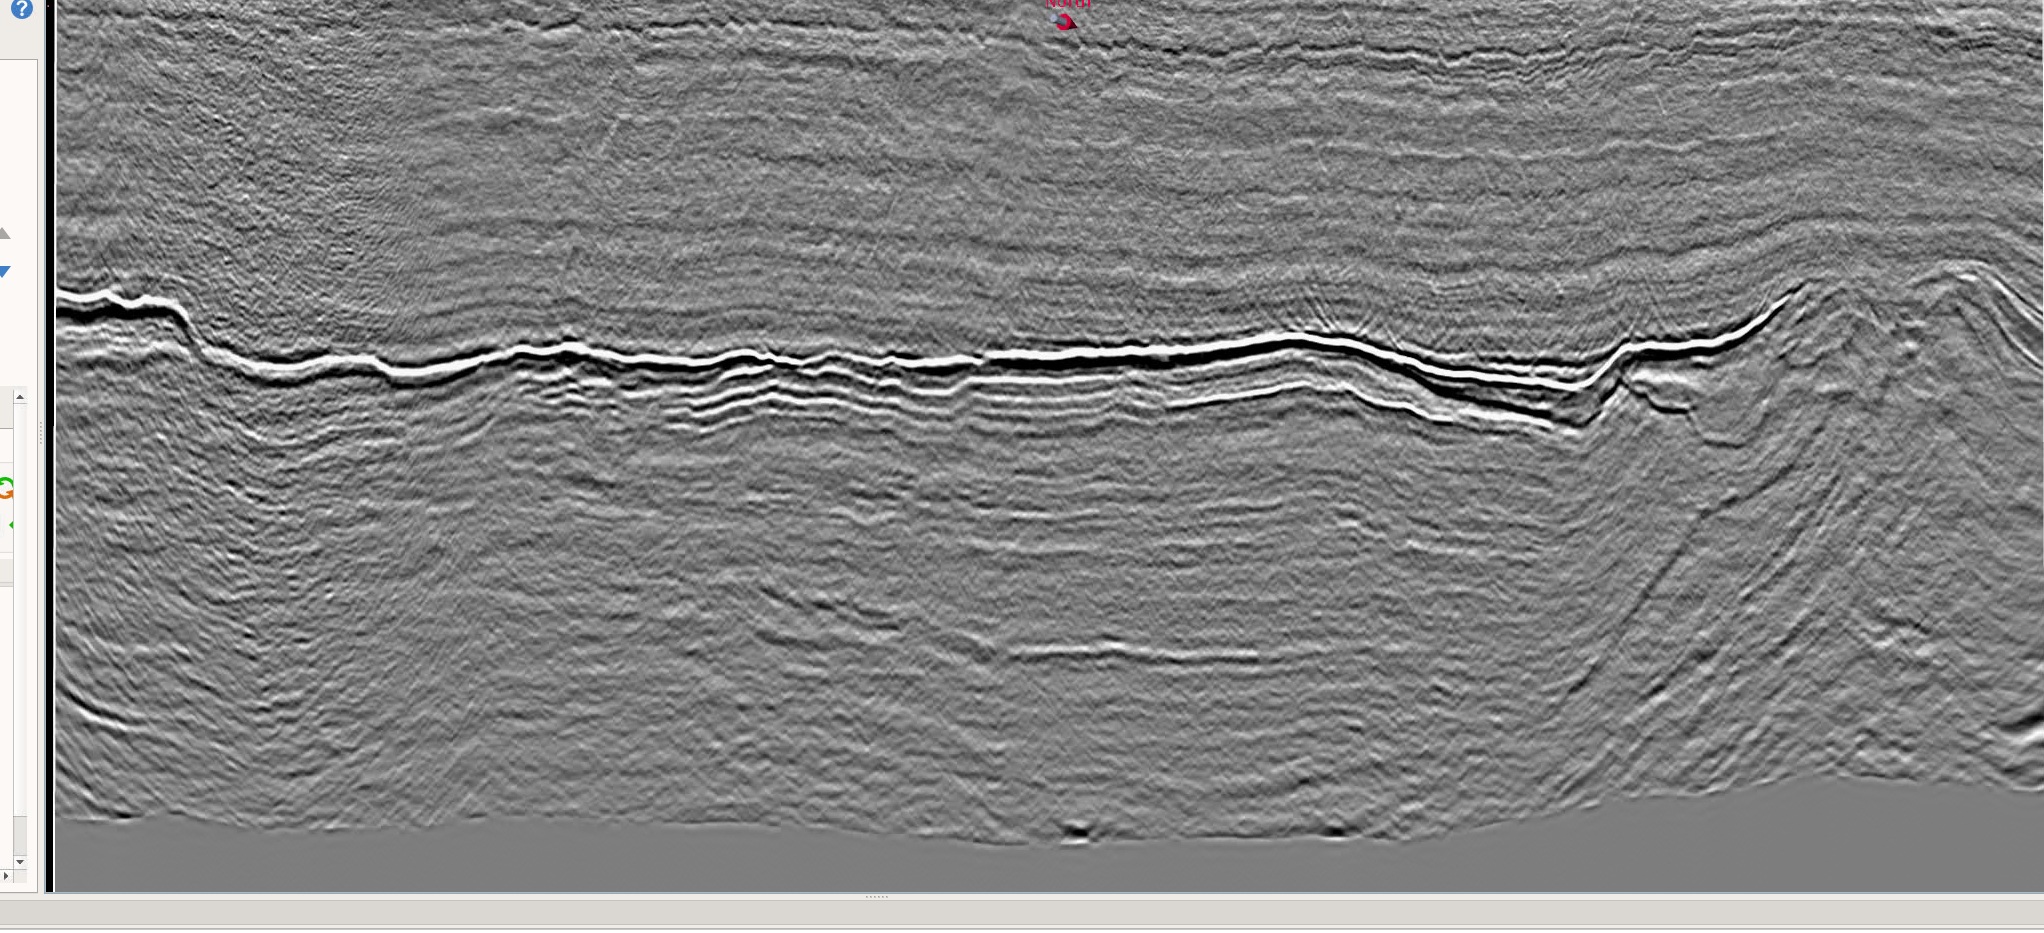
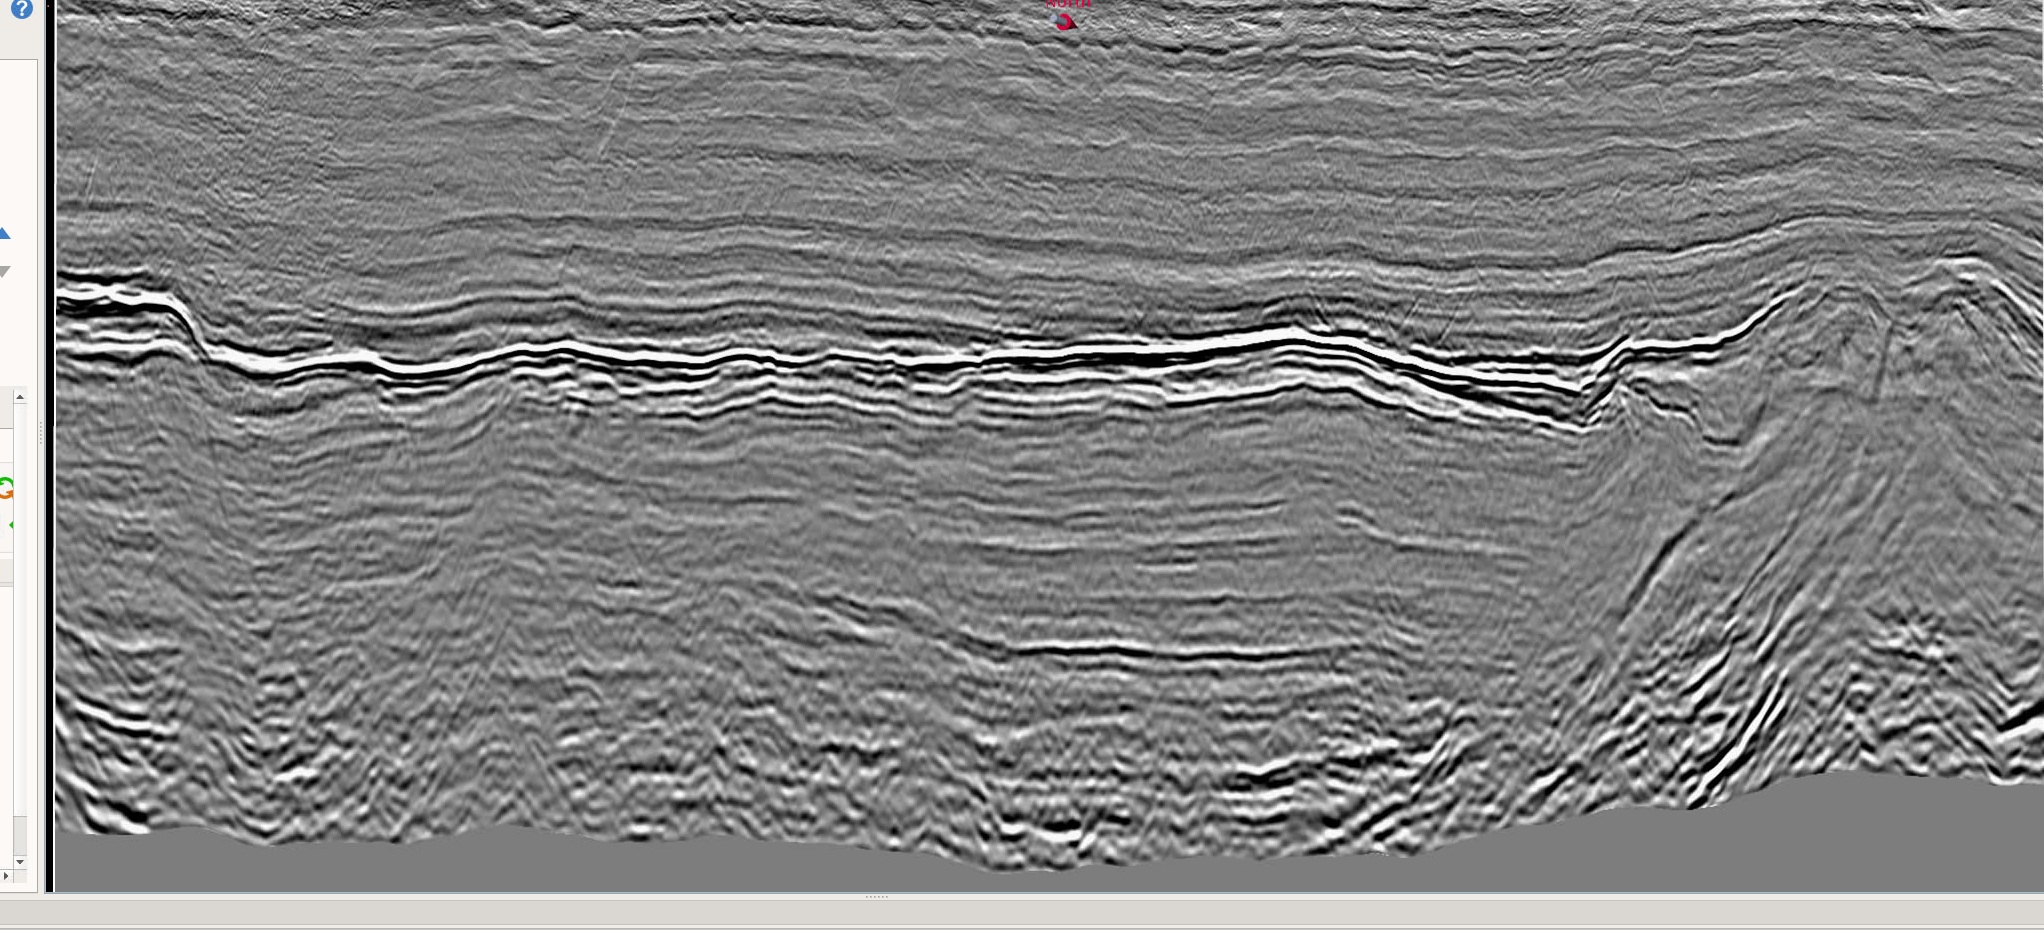
The Q-CRAM result improved imaging of the Jurassic and Cretaceous intervals and produced a clearer dataset for screening and interpretation work.
Dedicated Q and regularisation example
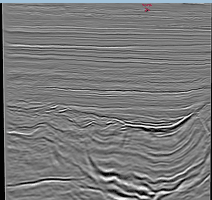
This case highlights the impact of regularisation together with Q-aware processing. The objective is to stabilise the image, improve continuity and sharpen the target response without losing geological consistency.
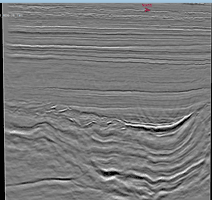
There is highly efficient workflow based on 5D
regularization that addresses issues related to surface
data coverage. It significantly reduces this noise, and
makes the Early Cretaceous section interpretable.
Improved confidence in reservoir response
The vintage PSDM showed brightening mainly at the base of the reservoir, raising uncertainty over whether the seismic response reflected hydrocarbon presence or lithology alone.
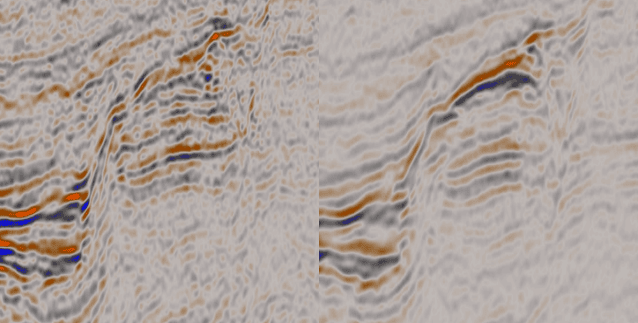
The reprocessed data showed a clearer response on both top and base reservoir, strengthening seismic support for the drilling decision and reducing the main amplitude-related risk.
Improved structural clarity below a challenging interval
This example shows a challenging structural setting where the reprocessed result improves event continuity and helps clarify the deeper image.
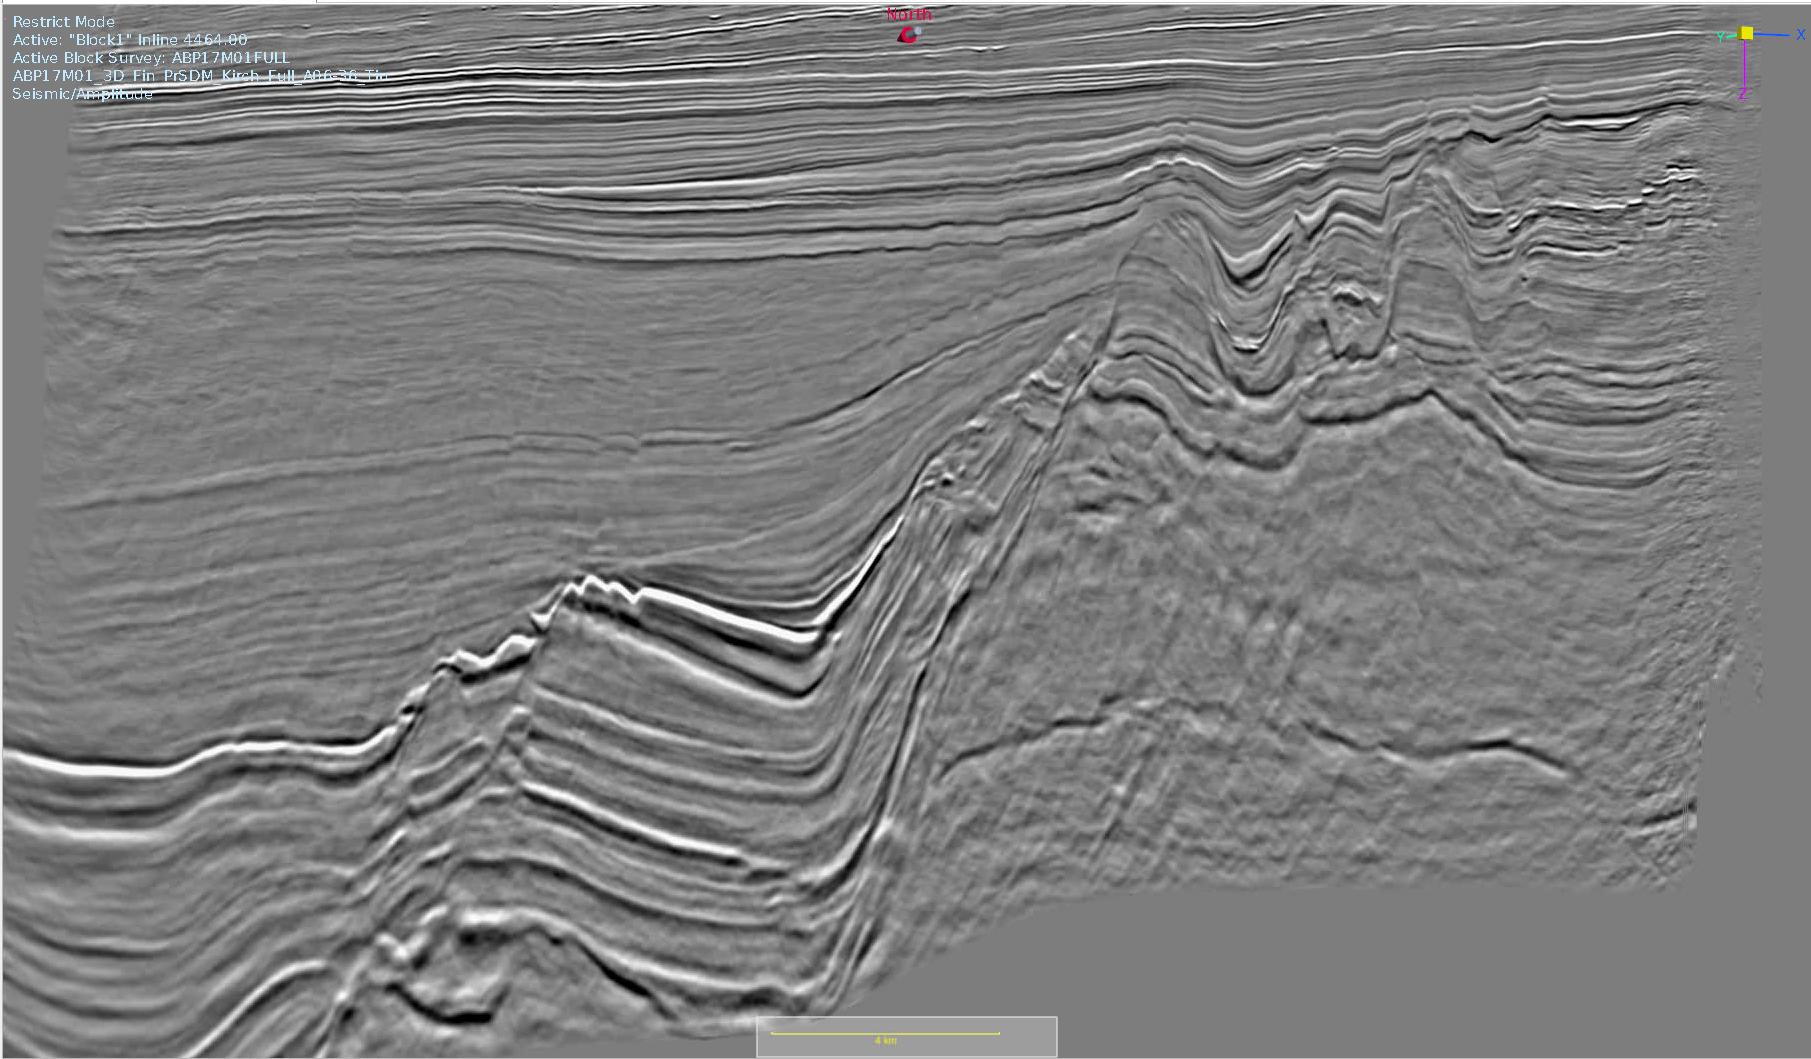
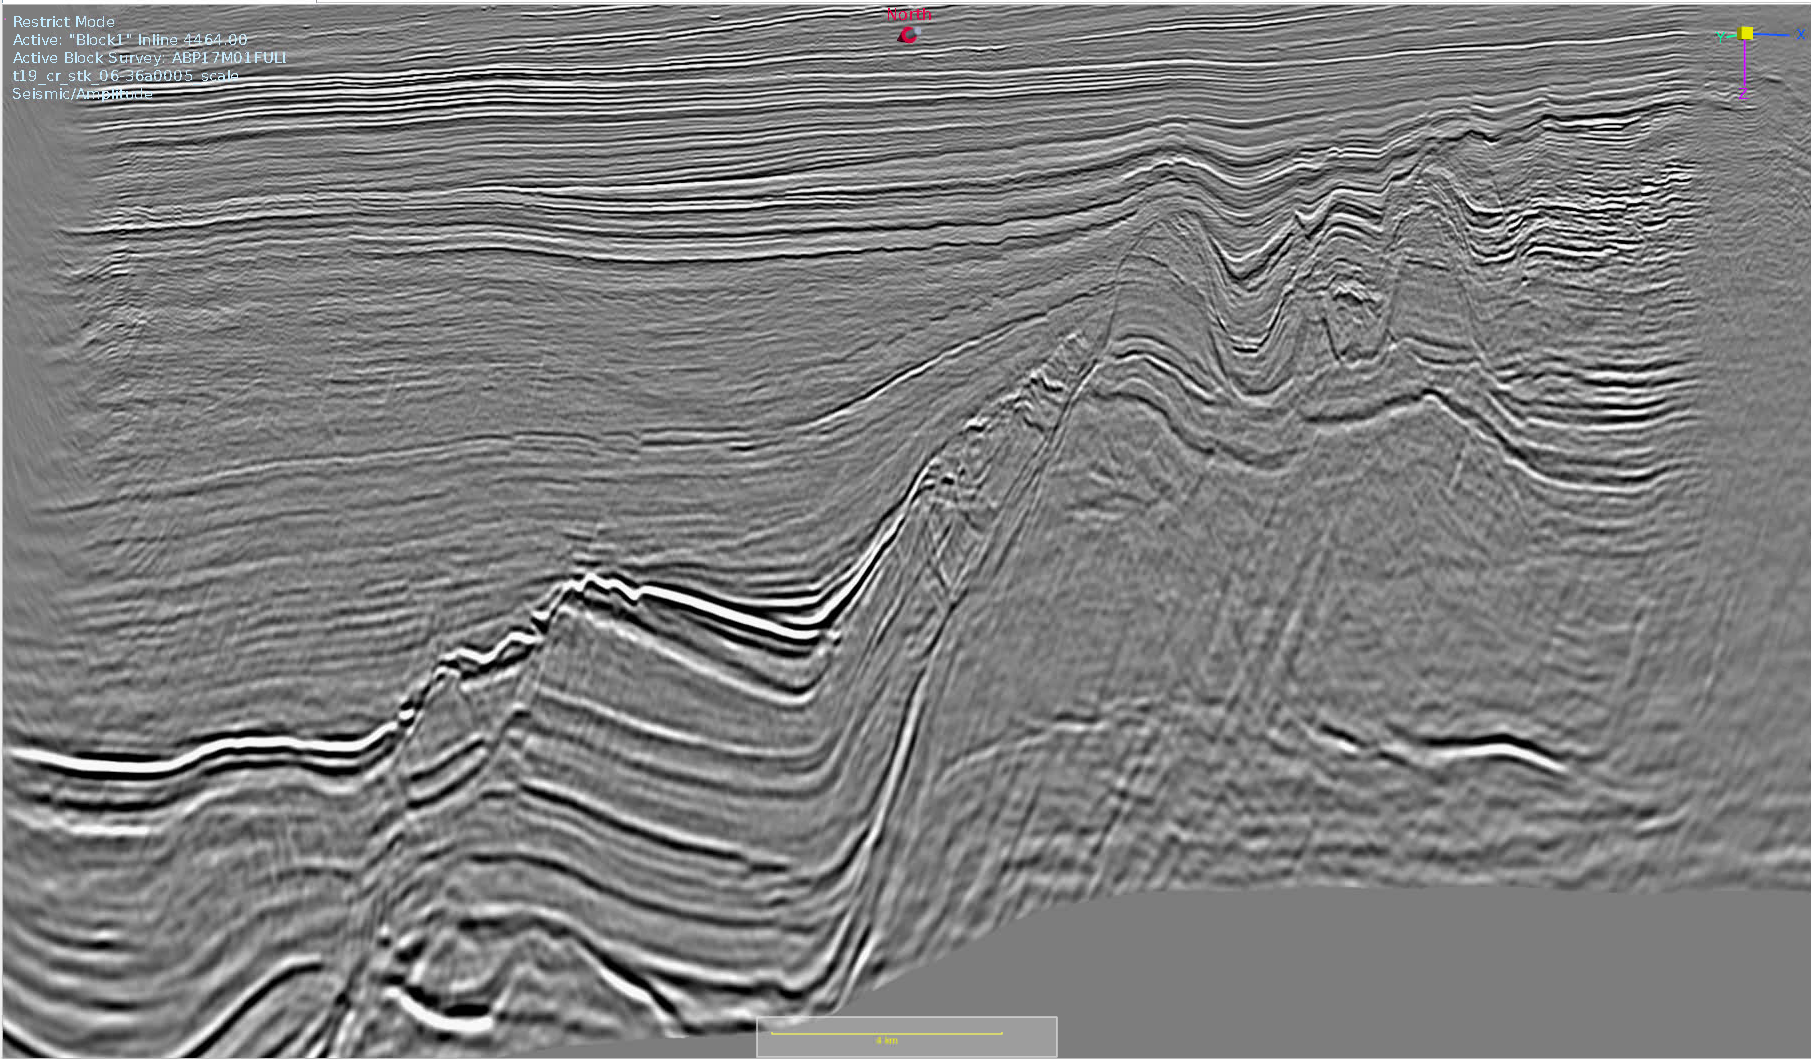
The reprocessed section presents cleaner structure and stronger continuity in the deeper part of the section, helping interpreters understand the geometry below the main high-contrast interval.
Cleaner imaging of the target reservoir
This case study highlights how reprocessing can produce a cleaner and more coherent reservoir image, improving the readability of key target events.
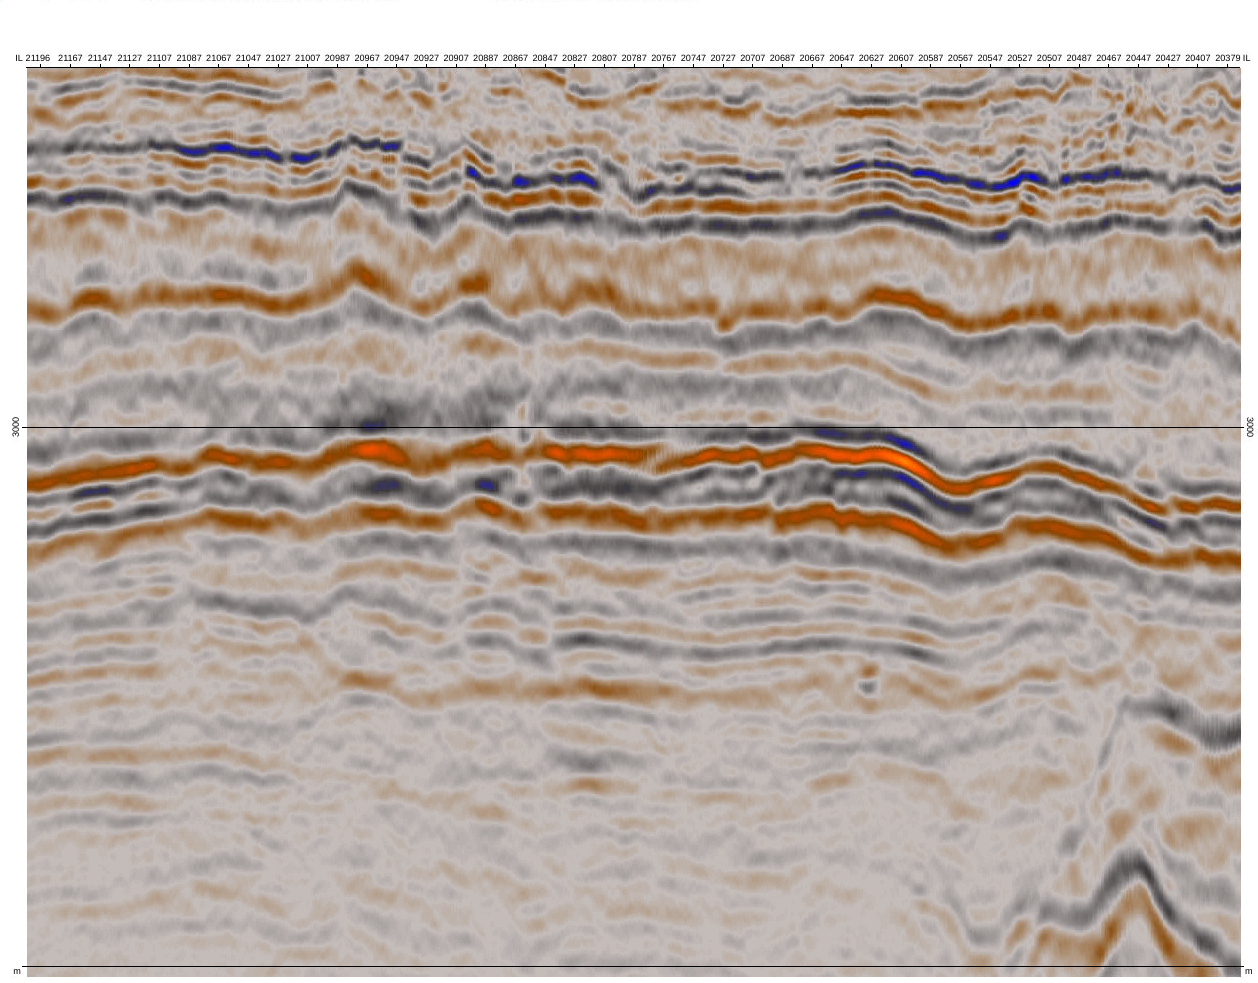
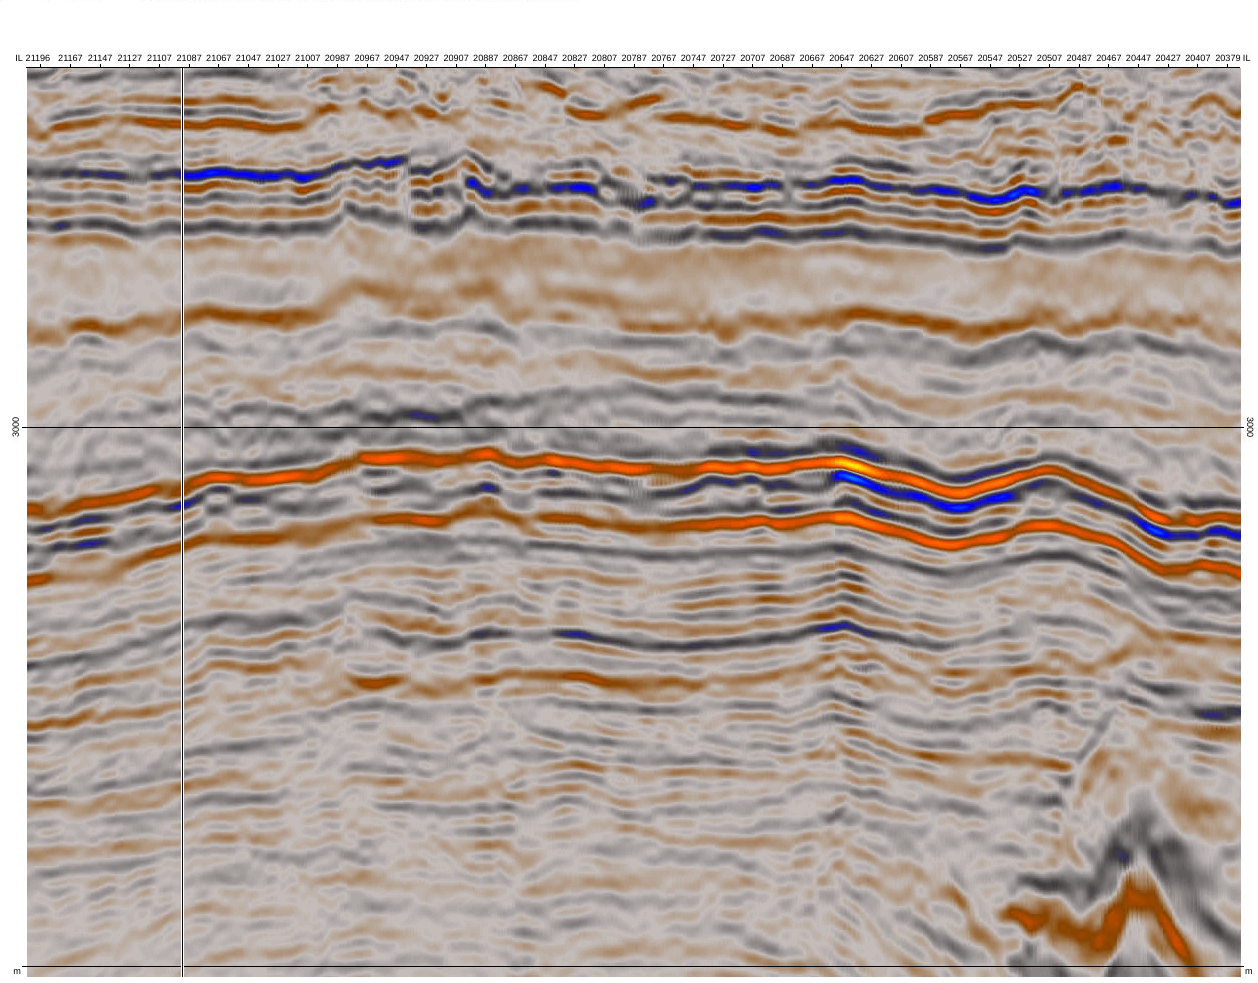
The after-image displays a cleaner and more stable representation of the reservoir interval, supporting more confident interpretation and amplitude assessment.
Improved imaging using conventional multi-azimuth coverage
This example illustrates how triple-azimuth imaging of conventional data can improve the image of a structurally complex target. The emphasis is on better illumination, continuity and imaging of steep dips.
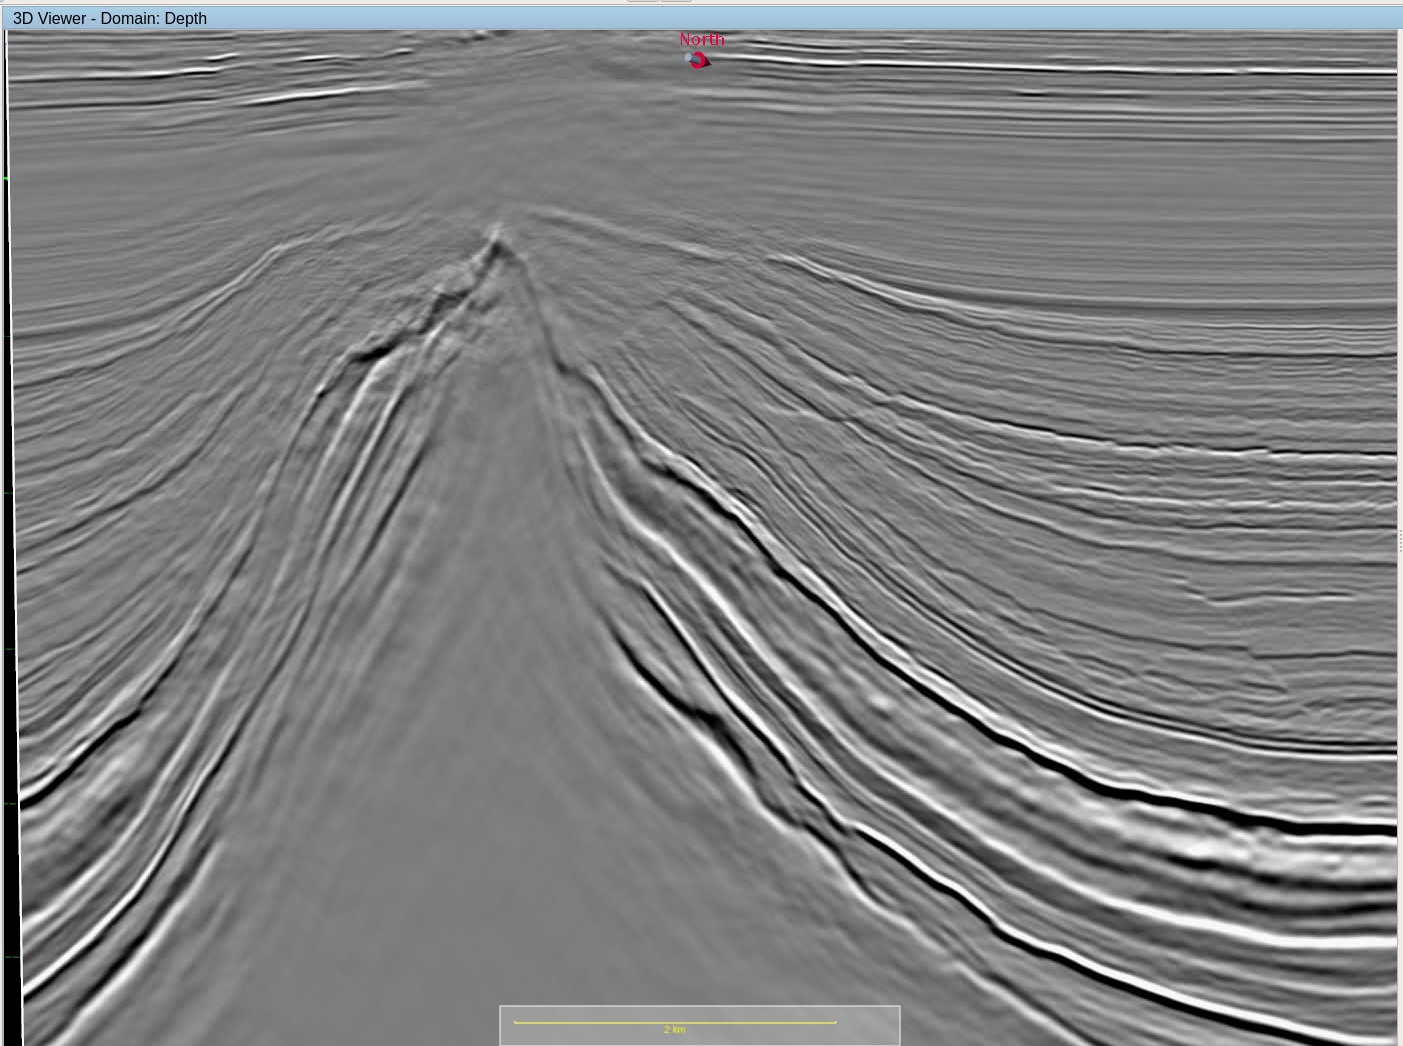
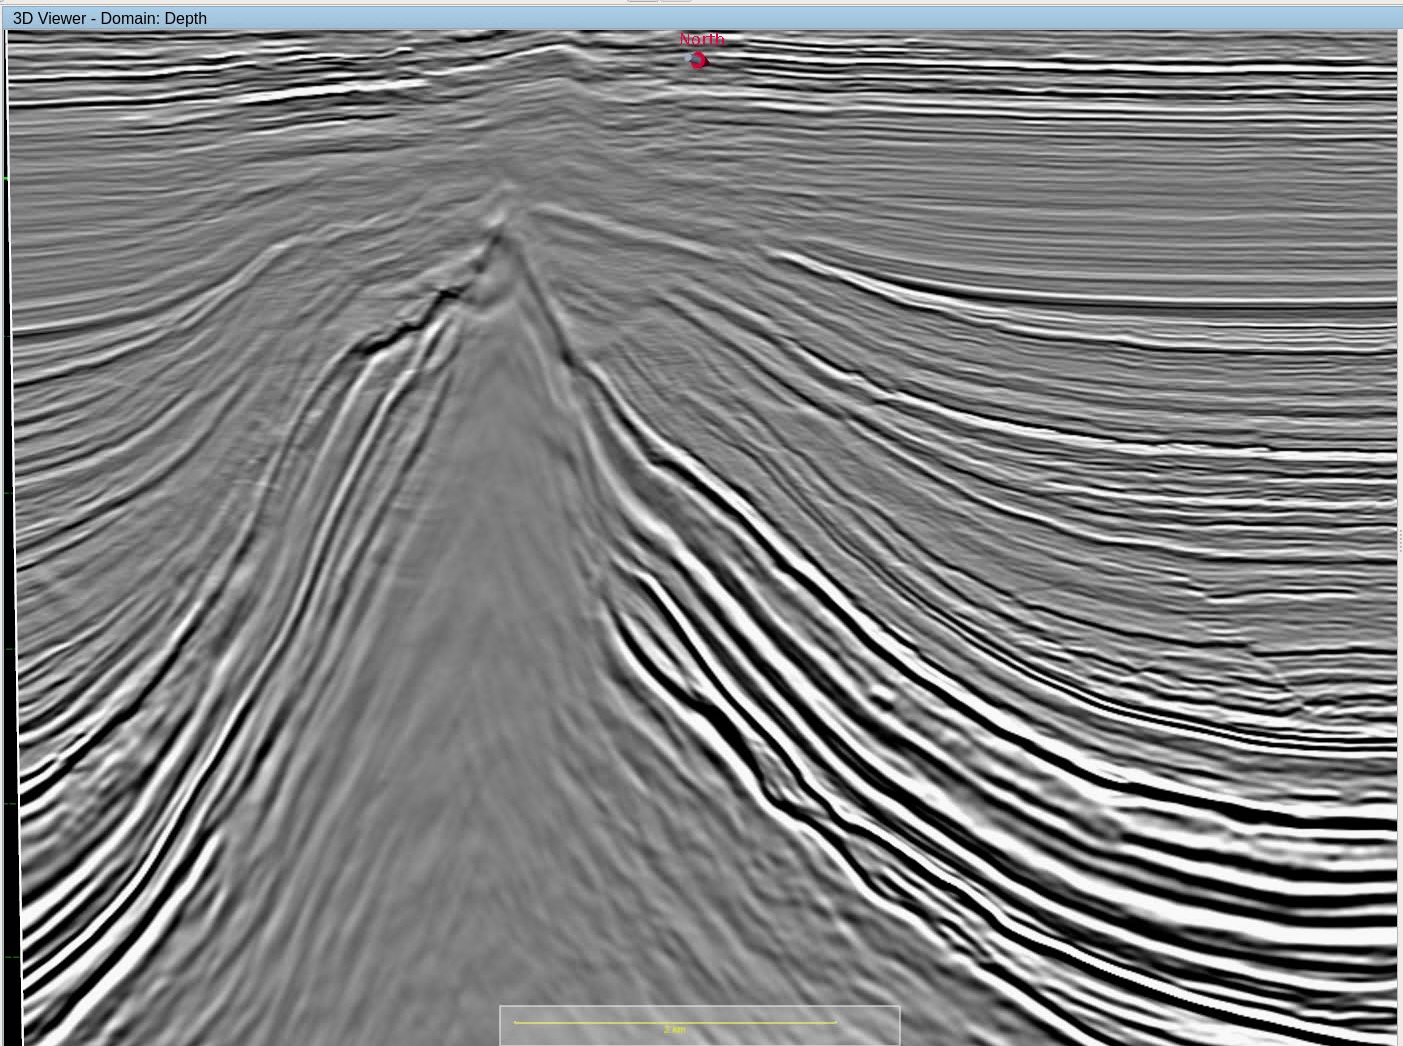
The multi-azimuth result gives a more stable and geologically usable image around the main structure. It demonstrates how conventional data with broader azimuth coverage can help resolve complex imaging challenges.
CRS KPSDM versus band-limited CRAM
In this onshore land seismic example, the aim was to improve imaging of the deep pre-Neogene structure in an area known for poor signal-to-noise ratio at depth.
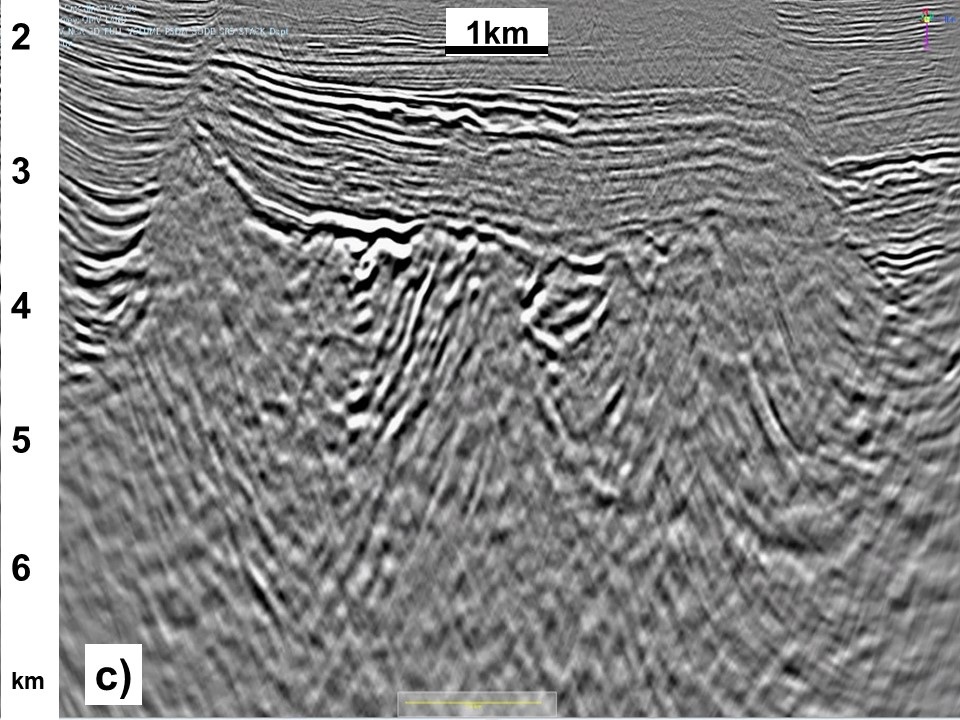
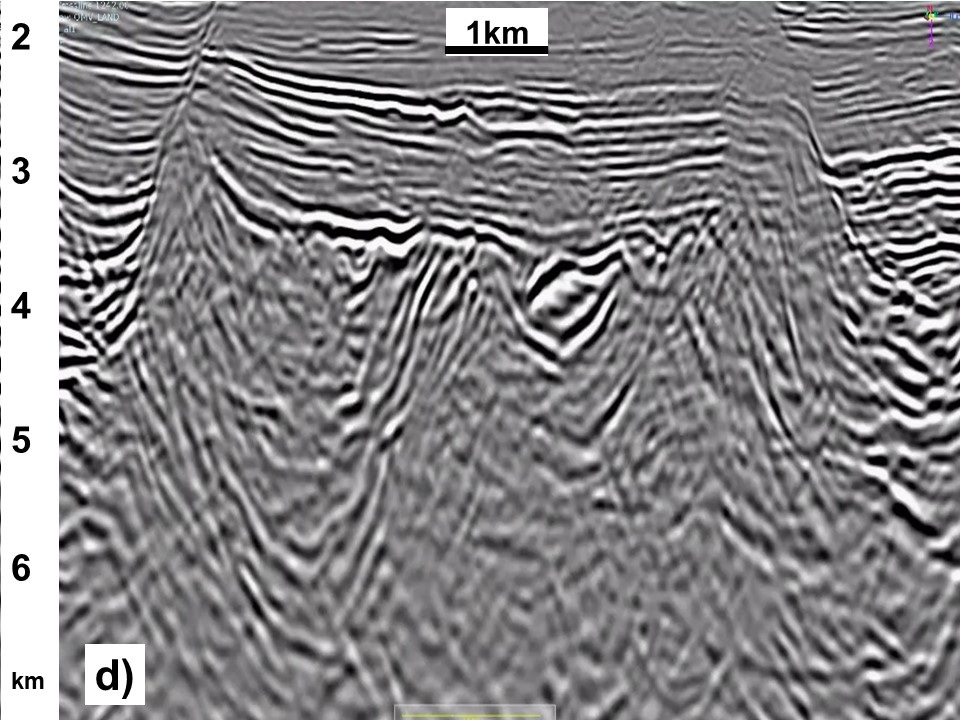
The CRAM result more clearly images steeply dipping events and fault planes while suppressing noise, improving understanding of the basin architecture and compartmentalisation of the reservoir units.
Source: Deep Structural Imaging in the Vienna Basin, First Break, Volume 41, Issue 12, Dec 2023, p. 31–35
Vintage CRS KPSDM versus high-frequency ES360
A vintage onshore land dataset was reprocessed to improve reservoir-level resolution using denoise, residual statics, 5D regularization, a well-derived velocity model, high-resolution tomography and Q migration.
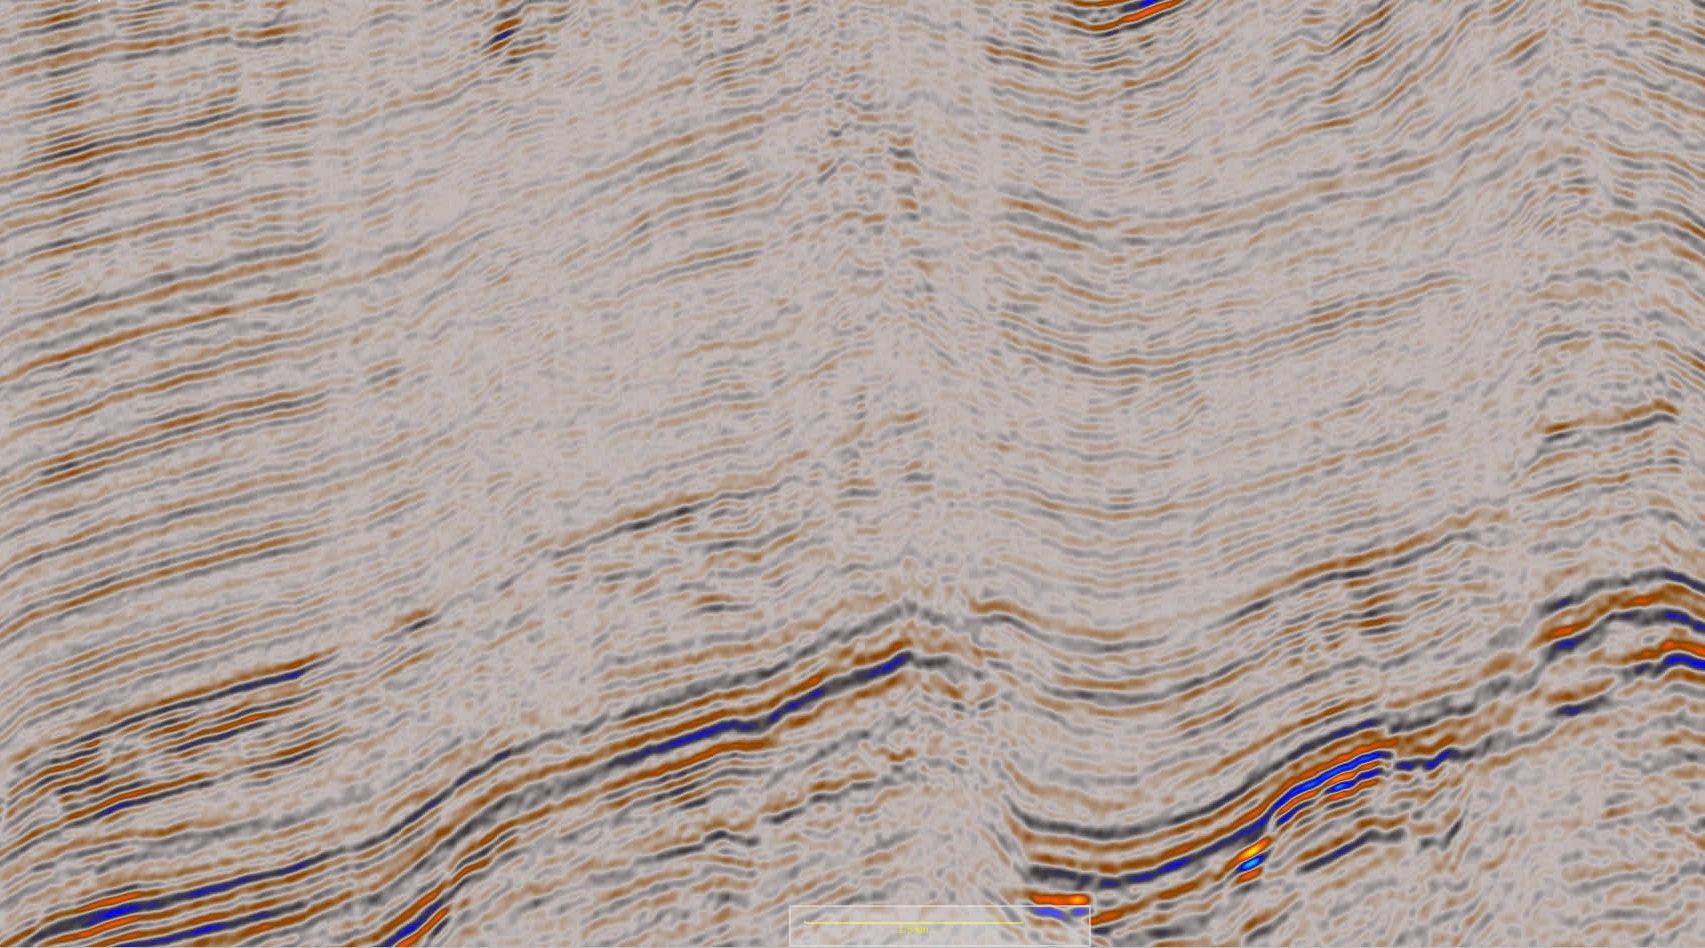
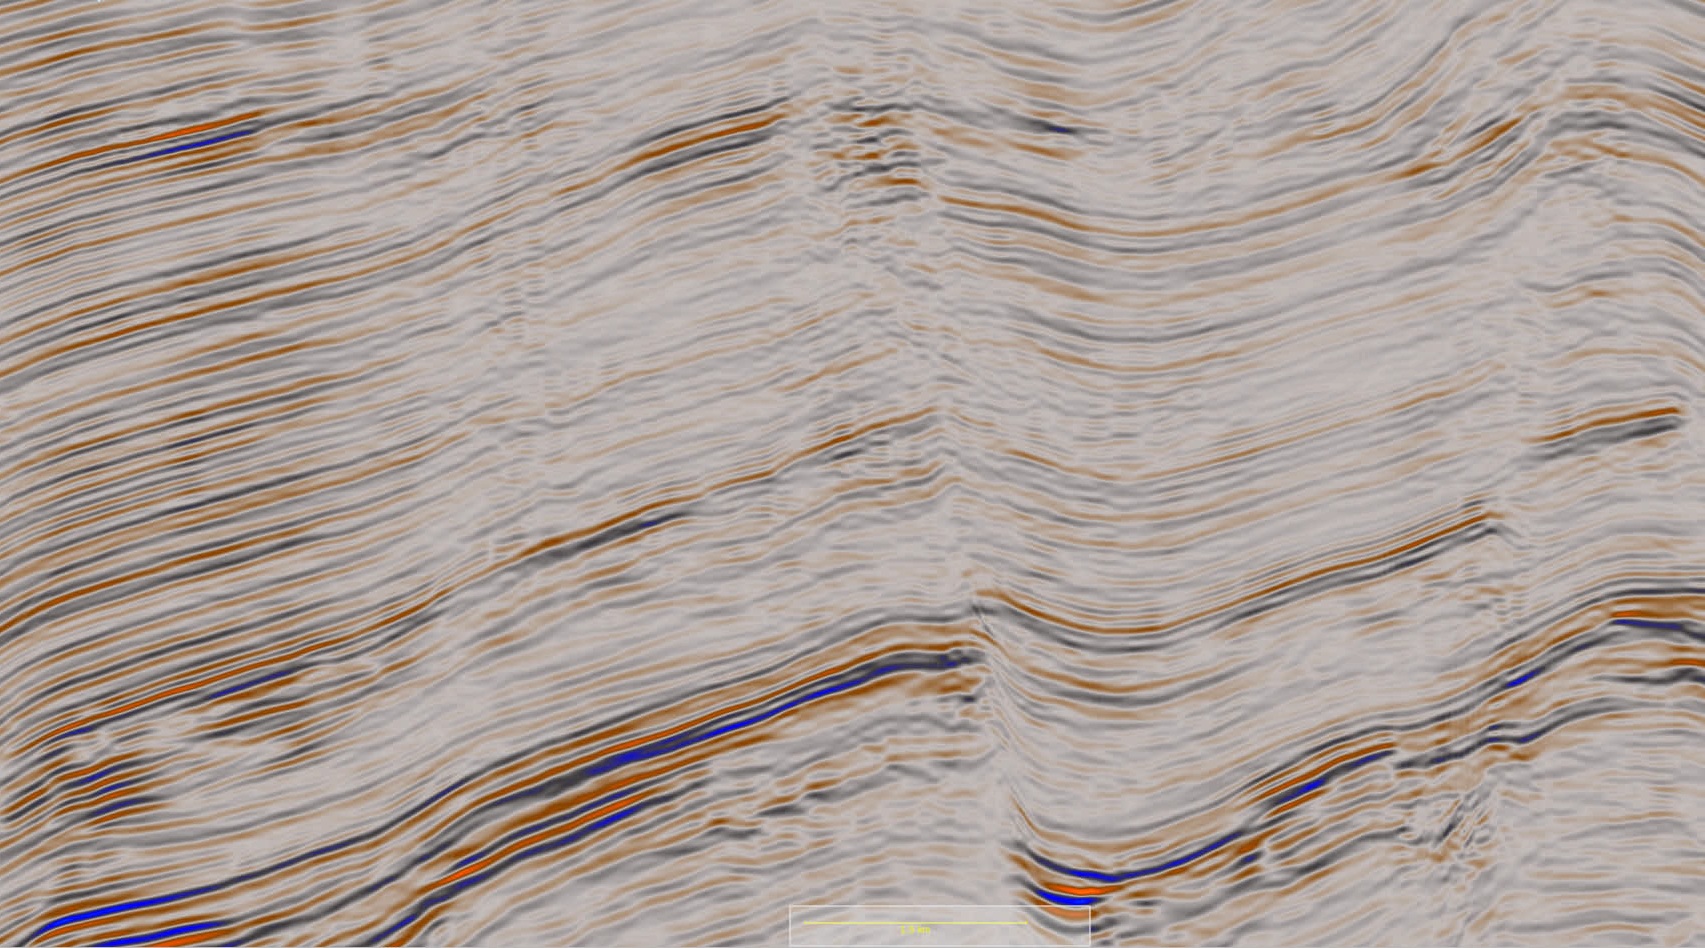
The high-frequency ES360 result enhanced the seismic bandwidth relative to the vintage KPSDM image, unlocking higher resolution and allowing more detailed interpretation within the reservoir interval.